The pressure-enthalpy diagram (log p-h diagram) and the basic process
Refrigeration Basics
The pressure-enthalpy diagram and the basic process
1. The pressure-enthalpy diagram (log ph diagram)
The thermodynamic properties of a refrigerant are often represented in a pressure-enthalpy diagram. Here, the logarithm of pressure is plotted as a function of enthalpy, with the various thermodynamic properties as parameters (see Figure 1). The main components are:
◆ The thick line (boiling line)
Contents
Jobs
Mounting
Mechanic/Welder (m/f/d) at GEA
We are looking for three mechanics/welders (m/f/d) at our Berlin location.
Image

GEA Refrigeration Germany GmbH
Berlin, Germany
Fulltime
Project management refrigeration technology
Commercial Employee Order Processing in Engineering (m/f/d)
To strengthen our team, we are looking for a commercial employee to handle engineering projects as soon as possible.
Image

MTA Deutschland GmbH
Nettetal, Germany
Fitter refrigeration technology
MTA Refrigeration Technician (m/f/d) in Customer Service for Baden-Württemberg
To strengthen our team for the Stuttgart region, we are looking for you as a Refrigeration Technician (m/f/d) for our customer service.
Image

MTA Deutschland GmbH
Nettetal, Germany
Fulltime
Get in Touch with the Author
If you have any questions or would like additional information, the author of this article is happy to assist you. Simply use the options below to get in touch directly.
Related Products
Image

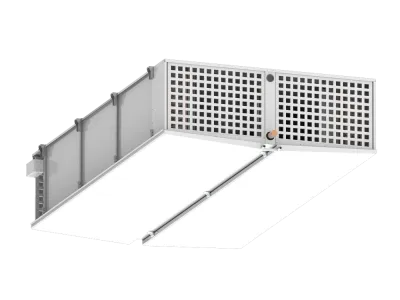
with a draught-free airflow and a low noise level
Image

Industrial air cooler (stainless steel/aluminium) - quiet and powerful
Image

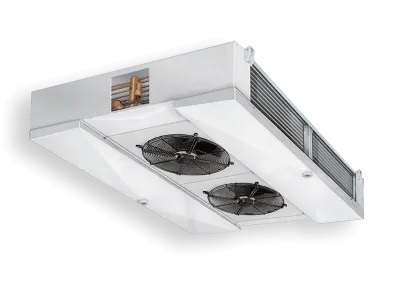
Double Sided Blowing High performance air cooler for cold rooms CDH
Image

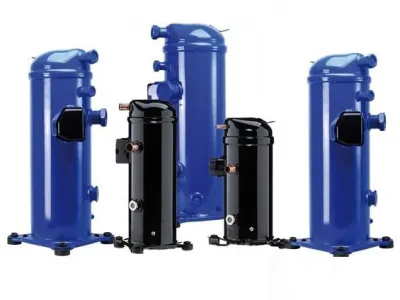
LLZ, MLZ and MLM scroll compressors for standard and compact commercial refrigeration applications
Image

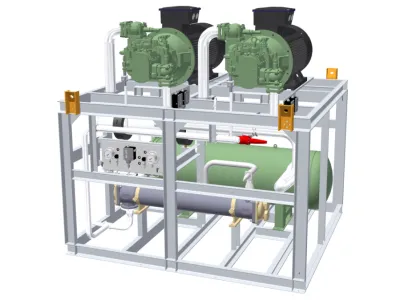
NH3 cooling plant solutions as single compressor units or as a parallel system with two open screw compressors
Cooling capacity MT: 70-1469 kW
Cooling capacity LT: 28-568 kW
Cooling capacity MT: 70-1469 kW
Cooling capacity LT: 28-568 kW
Image

The HK series is designed for high pressure. The compressor can compress gas up to 50 bar.
Related Articles
Drop-In Refrigerants - Definition and Application
Using Drop-In Refrigerants as an Environmentally Friendly Alternative
MAK Value – Maximum Workplace Concentration
The MAK value determines the safe concentration of substances in workplace air and protects individuals from health risks.
What is subcooling?
Reducing energy costs and ensuring the longevity of the system with subcooling.
The refrigeration cycle
The refrigeration cycle and its components explained simple
Basics Of Thermodynamics
Describes the transport and conversion of various forms of energy in systems.
condensing units Installation instructions
General information and practical tips for using Danfoss OptymaTM condensing units are given below. OptymaTM condensing units represent a complete range of units with hermetic Danfoss reciprocating compressors. The design of this series corresponds to the needs of the market. In general, to give an overview of the program, each subsection is divided into the different hermetic compressors mounted on the condensing units.
The refrigeration manufacturer
Mechatronics technician for refrigeration technology
Why refrigeration technology?
In certain areas of application, refrigeration systems are more energetic than conventional heating systems.
Energy optimization of refrigeration systems
Energy optimization of refrigeration systems

